Fixture Congestion Patterns Reshaping Predictive Models in Basketball and Rugby
Carlo Baumann · Oct 24, 2026
Fixture Congestion Patterns Reshaping Predictive Models in Basketball and Rugby
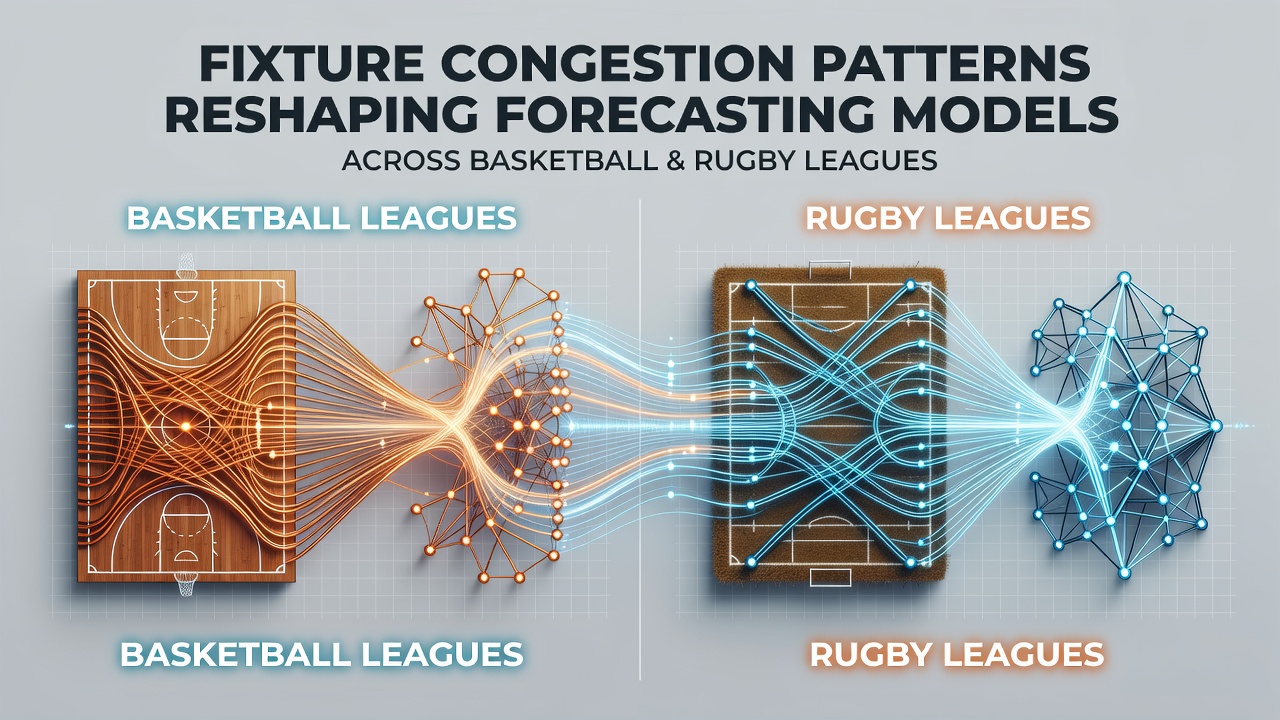
Fixture congestion occurs when teams face multiple matches within short time frames, and data from major leagues shows this pattern alters player output metrics used in forecasting models. In basketball competitions such as the NBA and EuroLeague, schedules often pack three or four games into a week during October 2026 stretches, while rugby union and league formats in competitions like the Premiership and NRL encounter similar clusters during international windows and domestic rounds. Researchers tracking these sequences note that recovery intervals shrink, which in turn modifies variables like points per possession in basketball and meters gained per carry in rugby.
Analysts adjust models by incorporating rest-day differentials and travel loads, since evidence from performance databases indicates that teams playing back-to-back fixtures show measurable drops in shooting efficiency and tackle completion rates. One study released by the Australian Institute of Sport examined rugby sevens squads across congested periods and found that high-intensity running volume decreased by 12 percent on average when matches occurred with less than 72 hours between them. Forecasters therefore integrate these figures into regression equations rather than relying solely on season-long averages.
Adjustments in Basketball Forecasting Frameworks
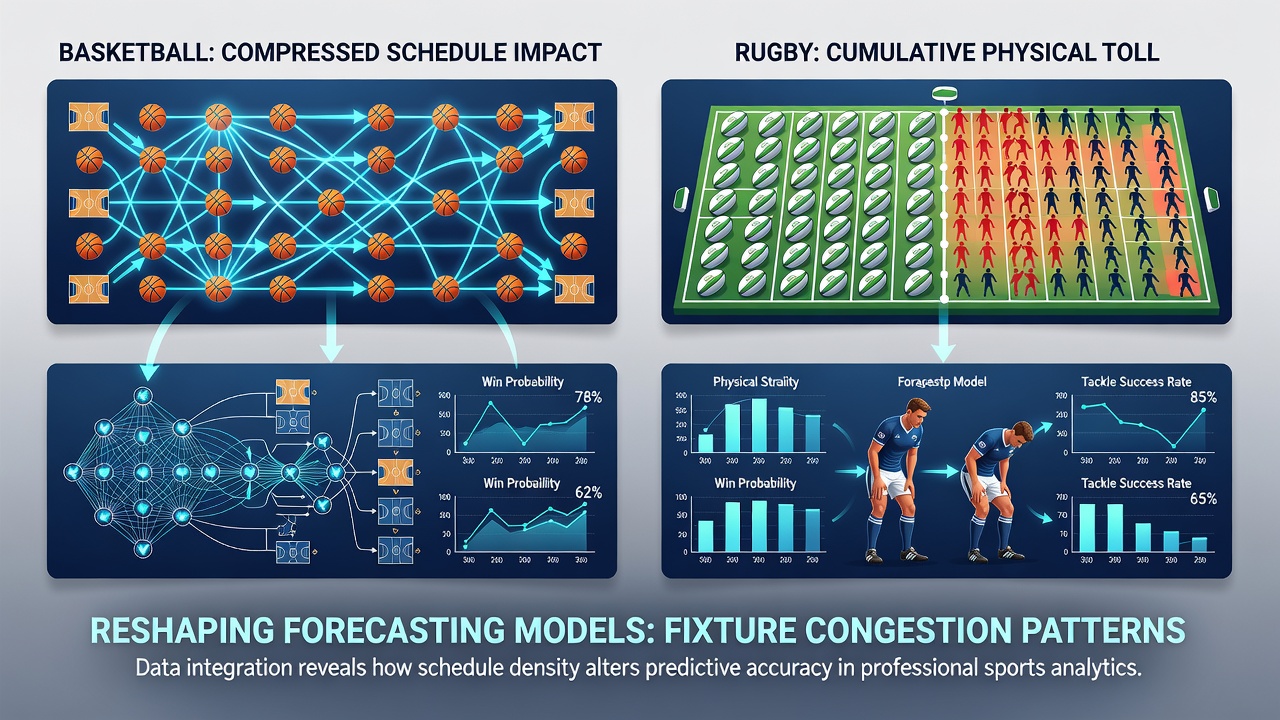
Basketball models traditionally emphasize offensive rating and defensive efficiency, yet congestion introduces additional layers because fatigue accumulates across consecutive nights. Data collected through October 2026 reveals that teams on the second night of back-to-backs record lower effective field goal percentages, prompting model builders to apply weighting factors that reduce projected outputs by 3 to 5 points per game. Machine-learning approaches now include variables for cumulative minutes played over the prior seven days, allowing algorithms to account for rotation patterns that coaching staffs employ to manage load.
External factors such as cross-country travel compound these effects, and statisticians incorporate flight duration and time-zone shifts into updated probability estimates. Observers note that forecasting platforms used by betting exchanges and media outlets have begun publishing adjusted lines that reflect these patterns rather than static season averages.
Rugby Model Modifications and Recovery Metrics
Rugby forecasting relies on metrics including post-contact meters, scrum success rates, and line-break conversions, yet congestion alters their reliability because muscle soreness and reduced decision-making speed appear after repeated high-collision weeks. Performance logs from the 2025-2026 Super Rugby Pacific season demonstrate that teams contesting three matches in 14 days produced 8 percent fewer clean breaks than squads with standard rest, leading analysts to recalibrate expected-value calculations. Newer models apply exponential decay functions to recent performance data, giving greater emphasis to matches played after adequate recovery while down-weighting congested sequences.
Coaching data from multiple unions shows increased use of bench rotations during these periods, and forecasters now track substitution timing as an input variable. This approach produces more accurate win-probability estimates because it captures the tactical responses teams adopt when fixture density rises.
Cross-League Data Integration Practices
Model developers combine datasets from basketball and rugby to identify shared fatigue signatures, such as elevated injury incidence during congested blocks. Reports from the Canadian Sport Institute Pacific highlight that both sports exhibit similar declines in high-speed running metrics when rest falls below threshold levels, enabling shared algorithmic components across different league prediction engines. These integrated frameworks allow forecasters to test hypotheses on larger sample sizes while maintaining sport-specific tuning parameters.
Industry reports from the European Observatoire of Sport and Physical Activity further indicate that leagues releasing detailed fixture calendars earlier in the season enable more precise pre-adjustment of models, reducing forecast error rates by measurable margins in retrospective testing.
Conclusion
Fixture congestion continues to drive refinements in forecasting models for basketball and rugby leagues as statistical teams incorporate rest, travel, and rotation data into their core equations. Updated approaches yield projections that align more closely with observed outcomes during periods of schedule density. Continued collection of granular performance metrics through future seasons will support further calibration of these systems.